O'Reilly Radar
Visualization of the Week: Avengers Assemble:
Marvel's "The Avengers" opened in U.S. theaters last weekend, claiming the largest weekend opening so far this year and setting a new three-day domestic box office record. The film features a superhero team comprised of Iron Man, Thor, The Hulk, Captain America, Black Widow, and Hawkeye. But as fans of the comics know, this isn't the original or the only composition of "The Avengers." When the team first appeared in 1963, it was made up of Iron Man, Ant-Man, Wasp, Thor, and the Hulk. Captain America was discovered frozen in ice in Issue #4. The only real constant of "The Avengers" over the years is its rotating roster of superheroes.
That changing makeup of "The Avengers" is the theme of this week's visualization, created by The New York Times' data artist in residence Jer Thorp. On his blog, Thorp has posted a series of visualizations about these superheroes that uses comicvine.com's API.
Thorp writes:
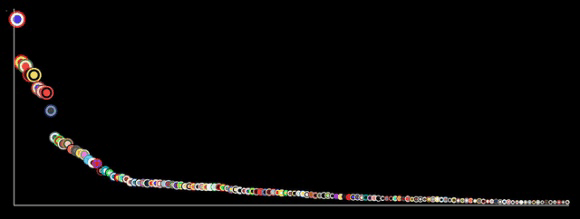
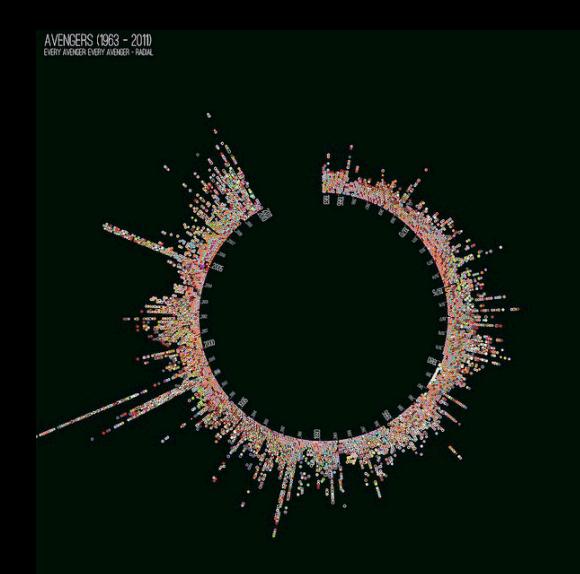
"My first thought was to use images of the characters in my visualizations, but while the Comic Vine API provides images in all kinds of sizes, the styles of drawing are so varied that it ended up not holding together. Instead, then, I built a small tool that let me go through those characters and pick three colours that I thought represented them the best (everybody gets a shield!)."
Below is a depiction of all "The Avengers" characters, ordered by the frequency in which they appear in the series.

And sorting by issue (characters appearing in an issue together form a radial line), here is every appearance of every Avenger team member in every issue.

Read the full post to see many more visualizations based on "The Avengers," including the gender ratio of the superhero team and the types of villains they often had to assemble to battle.
Found a great visualization? Tell us about it
This post is part of an ongoing series exploring visualizations. We're always looking for leads, so please drop a line if there's a visualization you think we should know about.
 Fluent Conference: JavaScript & Beyond — Explore the changing worlds of JavaScript & HTML5 at the O'Reilly Fluent Conference (May 29 - 31 in San Francisco, Calif.).
Save 20% on registration with the code RADAR20


